Spike Data Preparation
Download raw DMS functional selection data for SARS-CoV-2 spike variants (Delta, BA.1, BA.2), apply improved count-aggregation data preparation, and save training functional scores.
Outline
Download raw data from the public repository (cached for subsequent runs)
Load and concatenate raw functional selection CSVs
Select replicates and map to condition names
Remove deletions and invalid variants
Aggregate barcode counts per (condition, replicate, aa_substitutions)
Apply count-based filtering (pre_count, post_count thresholds)
Apply mutation-number filtering (max_subs)
Truncate nonsense variants (premature-stop logic)
Compute functional scores as log-ratios of aggregated counts
Subtract wildtype score, clip, and save
Replicate correlation analysis
[1]:
import warnings

warnings.filterwarnings("ignore")

import os
import sys

sys.path.insert(0, "notebooks")

import matplotlib.pyplot as plt
import numpy as np
import pandas as pd
import seaborn as sns
from scipy import stats

from _common import download_data, load_config, load_raw_data, truncate_nonsense

%matplotlib inline
[2]:
config_path = "config/config.yaml"
[3]:
# Parameters
config_path = "config/config.yaml"
[4]:
config = load_config(config_path)
spike = config["spike"]
seed = config["seed"]

reference = spike["reference"]
experiment_conditions = spike["experiment_conditions"]
replicate_1_experiments = spike["replicate_1_experiments"]
replicate_2_experiments = spike["replicate_2_experiments"]
pre_count_threshold = spike["pre_count_threshold"]
post_count_threshold = spike["post_count_threshold"]
max_subs = spike["max_subs"]
func_score_clip = spike["func_score_clip"]
pseudocount = spike["pseudocount"]
do_truncate_nonsense = spike["do_truncate_nonsense"]
subsample_frac = spike.get("subsample_frac", None)
condition_colors = spike["condition_colors"]
condition_titles = spike["condition_titles"]

output_dir = "results"
os.makedirs(output_dir, exist_ok=True)

np.random.seed(seed)
print(f"Reference: {reference}")
print(f"Conditions: {experiment_conditions}")
print(f"Replicate 1: {replicate_1_experiments}")
print(f"Replicate 2: {replicate_2_experiments}")
Reference: Omicron_BA1
Conditions: ['Delta', 'Omicron_BA1', 'Omicron_BA2']
Replicate 1: ['Delta-2', 'Omicron_BA1-2', 'Omicron_BA2-1']
Replicate 2: ['Delta-4', 'Omicron_BA1-3', 'Omicron_BA2-2']
Download and load raw data
Download raw functional selection CSVs from the public GitHub repository. Files are cached locally in results/raw_data/ for subsequent runs.
[5]:
print("Downloading raw data (skips if cached)...")
raw_df = load_raw_data(spike, cache_dir=os.path.join(output_dir, "raw_data"))
print(f"Loaded {len(raw_df):,} total variant rows across all experiments")
print(f"Experiments: {sorted(raw_df['condition'].unique())}")
Downloading raw data (skips if cached)...
  Downloading https://raw.githubusercontent.com/matsengrp/SARS-CoV-2_spike_multidms/main/data/Delta/functional_selections.csv
  Downloading https://raw.githubusercontent.com/matsengrp/SARS-CoV-2_spike_multidms/main/data/Delta/Lib-1_2021-10-28_thaw-1_VSVG_control_1_vs_2021-12-14_thaw-1_no-antibody_control_1_func_scores.csv
  Downloading https://raw.githubusercontent.com/matsengrp/SARS-CoV-2_spike_multidms/main/data/Delta/Lib-1_2021-10-28_thaw-1_VSVG_control_2_vs_2021-12-14_thaw-1_no-antibody_control_2_func_scores.csv
  Downloading https://raw.githubusercontent.com/matsengrp/SARS-CoV-2_spike_multidms/main/data/Delta/Lib-3_2021-10-28_thaw-1_VSVG_control_1_vs_2021-12-14_thaw-1_no-antibody_control_1_func_scores.csv
  Downloading https://raw.githubusercontent.com/matsengrp/SARS-CoV-2_spike_multidms/main/data/Delta/Lib-3_2021-10-28_thaw-1_VSVG_control_2_vs_2021-12-14_thaw-1_no-antibody_control_2_func_scores.csv
  Downloading https://raw.githubusercontent.com/matsengrp/SARS-CoV-2_spike_multidms/main/data/Delta/Lib-4_2021-10-28_thaw-1_VSVG_control_1_vs_2021-12-14_thaw-1_no-antibody_control_1_func_scores.csv
  Downloading https://raw.githubusercontent.com/matsengrp/SARS-CoV-2_spike_multidms/main/data/Delta/Lib-4_2021-10-28_thaw-1_VSVG_control_2_vs_2021-12-14_thaw-1_no-antibody_control_2_func_scores.csv
  Downloading https://raw.githubusercontent.com/matsengrp/SARS-CoV-2_spike_multidms/main/data/Delta/Lib-2_2021-10-28_thaw-1_VSVG_control_1_vs_2021-11-28_thaw-1_no-antibody_control_1_func_scores.csv
  Downloading https://raw.githubusercontent.com/matsengrp/SARS-CoV-2_spike_multidms/main/data/Delta/Lib-2_2021-10-28_thaw-1_VSVG_control_2_vs_2021-11-28_thaw-1_no-antibody_control_2_func_scores.csv
  Downloading https://raw.githubusercontent.com/matsengrp/SARS-CoV-2_spike_multidms/main/data/Omicron_BA1/functional_selections.csv
  Downloading https://raw.githubusercontent.com/matsengrp/SARS-CoV-2_spike_multidms/main/data/Omicron_BA1/Lib-1_2022-03-25_thaw-1_VSVG_control_1_vs_2022-04-13_thaw-1_no-antibody_control_1_func_scores.csv
  Downloading https://raw.githubusercontent.com/matsengrp/SARS-CoV-2_spike_multidms/main/data/Omicron_BA1/Lib-1_2022-03-25_thaw-1_VSVG_control_2_vs_2022-04-13_thaw-1_no-antibody_control_2_func_scores.csv
  Downloading https://raw.githubusercontent.com/matsengrp/SARS-CoV-2_spike_multidms/main/data/Omicron_BA1/Lib-2_2022-06-22_thaw-1_VSVG_control_1_vs_2022-06-22_thaw-1_no-antibody_control_1_func_scores.csv
  Downloading https://raw.githubusercontent.com/matsengrp/SARS-CoV-2_spike_multidms/main/data/Omicron_BA1/Lib-3_2022-06-22_thaw-1_VSVG_control_1_vs_2022-06-22_thaw-1_no-antibody_control_1_func_scores.csv
  Downloading https://raw.githubusercontent.com/matsengrp/SARS-CoV-2_spike_multidms/main/data/Omicron_BA2/functional_selections.csv
  Downloading https://raw.githubusercontent.com/matsengrp/SARS-CoV-2_spike_multidms/main/data/Omicron_BA2/Lib-1_2022-10-22_thaw-1_VSVG_control_1_vs_2022-10-22_thaw-1_no-antibody_control_1_func_scores.csv
  Downloading https://raw.githubusercontent.com/matsengrp/SARS-CoV-2_spike_multidms/main/data/Omicron_BA2/Lib-2_2022-10-22_thaw-1_VSVG_control_1_vs_2022-10-22_thaw-1_no-antibody_control_1_func_scores.csv
  Downloading https://raw.githubusercontent.com/matsengrp/SARS-CoV-2_spike_multidms/main/data/Omicron_BA2/Lib-1_2022-10-22_thaw-2_VSVG_control_1_vs_2022-10-22_thaw-2_no-antibody_control_1_func_scores.csv
  Downloading https://raw.githubusercontent.com/matsengrp/SARS-CoV-2_spike_multidms/main/data/Omicron_BA2/Lib-2_2022-10-22_thaw-2_VSVG_control_1_vs_2022-10-22_thaw-2_no-antibody_control_1_func_scores.csv
Loaded 1,135,096 total variant rows across all experiments
Experiments: ['Delta-1', 'Delta-2', 'Delta-3', 'Delta-4', 'Omicron_BA1-1', 'Omicron_BA1-2', 'Omicron_BA1-3', 'Omicron_BA2-1', 'Omicron_BA2-2']
Select replicates
Map experiment names (e.g. Delta-2) to condition + replicate number.
[6]:
rep1_df = (
    raw_df.query("condition in @replicate_1_experiments")
    .assign(
        condition=lambda df: df["condition"].replace(
            dict(zip(replicate_1_experiments, experiment_conditions))
        ),
        replicate="1",
    )
)
rep2_df = (
    raw_df.query("condition in @replicate_2_experiments")
    .assign(
        condition=lambda df: df["condition"].replace(
            dict(zip(replicate_2_experiments, experiment_conditions))
        ),
        replicate="2",
    )
)
df = pd.concat([rep1_df, rep2_df], ignore_index=True)
print(f"Selected {len(df):,} variant rows across replicates")
print(f"Conditions: {sorted(df['condition'].unique())}")
print(f"Variants per condition/replicate:")
print(df.groupby(["condition", "replicate"]).size().to_string())
Selected 780,734 variant rows across replicates
Conditions: ['Delta', 'Omicron_BA1', 'Omicron_BA2']
Variants per condition/replicate:
condition    replicate
Delta        1             83172
             2             79388
Omicron_BA1  1            140643
             2            125127
Omicron_BA2  1            181984
             2            170420
Remove deletions and invalid variants
Drop variants with deletion characters (-) in substitutions, and variants with stop-codon wildtype or non-numeric site numbering.
[7]:
n_before = len(df)

# Remove deletions
has_deletion = df["aa_substitutions"].str.contains("-", regex=False)
df = df.loc[~has_deletion].copy()
print(f"Removed {has_deletion.sum():,} variants with deletions")

# Remove stop-codon wildtypes (substitutions starting with *)
has_stop_wt = df["aa_substitutions"].str.contains(r"(^|\s)\*", regex=True)
df = df.loc[~has_stop_wt].copy()
print(f"Removed {has_stop_wt.sum():,} variants with stop-codon wildtype")

# Remove non-numeric site numbering (indels)
has_non_numeric = df["aa_substitutions"].str.contains(
    r"[^0-9][A-Za-z*\-](\s|$)", regex=True
)
df = df.loc[~has_non_numeric].copy()
print(f"Removed {has_non_numeric.sum():,} variants with non-numeric sites")

print(f"\nTotal removed: {n_before - len(df):,} ({len(df):,} remaining)")
Removed 16,035 variants with deletions
Removed 497 variants with stop-codon wildtype
Removed 9,806 variants with non-numeric sites

Total removed: 26,338 (754,396 remaining)
Aggregate barcode counts
Sum pre-selection and post-selection counts for identical variants (same condition, replicate, and amino acid substitutions). This is the improved count-aggregation approach from the jaxmodels empirical fits notebook — statistically more principled than averaging pre-computed functional scores.
[8]:
df["n_subs"] = df["aa_substitutions"].apply(
    lambda x: len(x.split()) if x.strip() else 0
)

n_before_agg = len(df)
df = (
    df.groupby(["condition", "replicate", "aa_substitutions"], dropna=False)
    .agg({"n_subs": "first", "pre_count": "sum", "post_count": "sum"})
    .reset_index()
)
print(f"Aggregated {n_before_agg:,} barcode rows \u2192 {len(df):,} unique variants")
Aggregated 754,396 barcode rows → 326,545 unique variants
Pre vs post count distribution
[9]:
mutant_mask = df["aa_substitutions"] != ""
fig, axes = plt.subplots(1, len(experiment_conditions), figsize=(4 * len(experiment_conditions), 3.5))
for ax, cond in zip(axes, experiment_conditions):
    cond_mask = (df["condition"] == cond) & mutant_mask
    ax.scatter(
        df.loc[cond_mask, "pre_count"],
        df.loc[cond_mask, "post_count"],
        s=3, alpha=0.05, rasterized=True,
    )
    ax.axvline(pre_count_threshold, color="red", linestyle="--", linewidth=1)
    ax.axhline(post_count_threshold, color="red", linestyle="--", linewidth=1)
    ax.set_xscale("symlog", linthresh=1, linscale=0.5)
    ax.set_yscale("symlog", linthresh=1, linscale=0.5)
    ax.set_xlabel("Pre-selection count")
    ax.set_ylabel("Post-selection count")
    ax.set_title(condition_titles.get(cond, cond))
    ax.spines[["top", "right"]].set_visible(False)
plt.tight_layout()
plt.show()
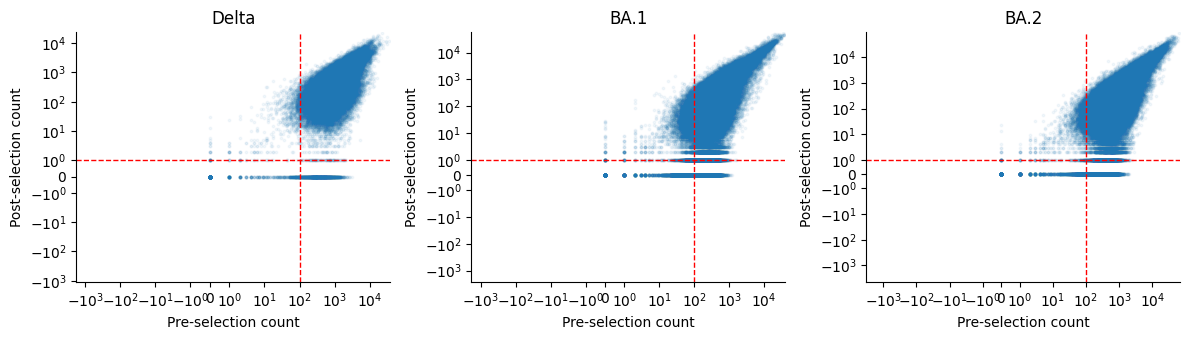
Count-based filtering
Filter variants by minimum pre-selection and post-selection counts.
[10]:
n_before = len(df)
df = df.query(
    "pre_count >= @pre_count_threshold and post_count >= @post_count_threshold"
).copy()
print(
    f"Count filter (pre >= {pre_count_threshold}, post >= {post_count_threshold}): "
    f"{n_before - len(df):,} removed, {len(df):,} remaining"
)
Count filter (pre >= 100, post >= 1): 38,674 removed, 287,871 remaining
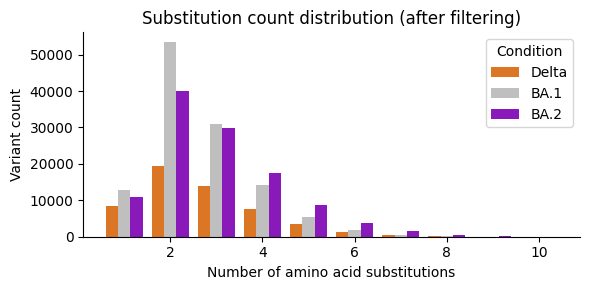
Mutation-number filtering
[11]:
n_before = len(df)
df = df.query("n_subs <= @max_subs").copy()
print(
    f"Mutation-number filter (n_subs <= {max_subs}): "
    f"{n_before - len(df):,} removed, {len(df):,} remaining"
)
Mutation-number filter (n_subs <= 10): 76 removed, 287,795 remaining
Substitution count distribution
[12]:
fig, ax = plt.subplots(figsize=(6, 3))
sns.countplot(
    data=df[df["aa_substitutions"] != ""],
    x="n_subs", hue="condition",
    palette=condition_colors,
    native_scale=True, ax=ax,
)
ax.set_xlabel("Number of amino acid substitutions")
ax.set_ylabel("Variant count")
ax.set_title("Substitution count distribution (after filtering)")
ax.spines[["top", "right"]].set_visible(False)
ax.legend(title="Condition", labels=[condition_titles.get(c, c) for c in experiment_conditions])
plt.tight_layout()
plt.show()
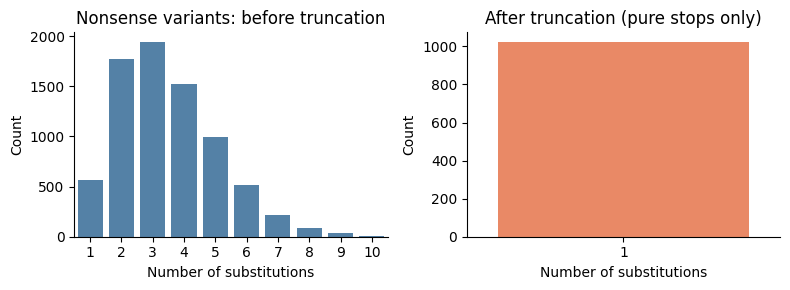
Premature-stop truncation
For variants containing stop codons, truncate mutations to include only those up to and including the first stop. Then re-aggregate counts for newly identical variants, and filter to retain only pure stop-codon variants (single mutation = stop) or all-missense variants.
[13]:
nonsense_mask = df["aa_substitutions"].str.contains("*", regex=False)

fig, axes = plt.subplots(1, 2, figsize=(8, 3))
sns.countplot(
    data=df.loc[nonsense_mask], x="n_subs",
    ax=axes[0], color="steelblue",
)
axes[0].set_title("Nonsense variants: before truncation")
axes[0].set_xlabel("Number of substitutions")
axes[0].set_ylabel("Count")
axes[0].spines[["top", "right"]].set_visible(False)

if do_truncate_nonsense:
    n_before = len(df)
    df = df.apply(truncate_nonsense, axis=1)

    # Re-aggregate identical variants after truncation
    df = (
        df.groupby(["condition", "replicate", "aa_substitutions"], dropna=False)
        .agg({"n_subs": "first", "pre_count": "sum", "post_count": "sum"})
        .reset_index()
    )

    # Filter: keep only pure stop variants (n_subs == 1) or all-missense
    mixed_mask = (
        df["aa_substitutions"].str.contains("*", regex=False) & (df["n_subs"] > 1)
    )
    df = df.loc[~mixed_mask].copy()
    print(
        f"Nonsense truncation: {n_before} \u2192 {len(df)} variants "
        f"({n_before - len(df)} removed/merged)"
    )

    nonsense_mask_after = df["aa_substitutions"].str.contains("*", regex=False)
    sns.countplot(
        data=df.loc[nonsense_mask_after], x="n_subs",
        ax=axes[1], color="coral",
    )
    axes[1].set_title("After truncation (pure stops only)")
else:
    axes[1].set_title("Truncation disabled")

axes[1].set_xlabel("Number of substitutions")
axes[1].set_ylabel("Count")
axes[1].spines[["top", "right"]].set_visible(False)
plt.tight_layout()
plt.show()
Nonsense truncation: 287795 → 281158 variants (6637 removed/merged)
Compute functional scores
Functional scores are log-ratios of aggregated counts:
where \(\epsilon\) is the pseudocount.
[14]:
df["func_score"] = (
    np.log(df["post_count"] + pseudocount) - np.log(df["pre_count"] + pseudocount)
)
print(f"Raw func_score range: [{df['func_score'].min():.3f}, {df['func_score'].max():.3f}]")
Raw func_score range: [-7.556, 3.020]
Wildtype subtraction
Subtract the wildtype functional score within each (condition, replicate) group so that wildtype variants have score 0.
[15]:
wt_scores = (
    df.query("aa_substitutions == ''")
    .rename(columns={"func_score": "wt_func_score"})
    [["condition", "replicate", "wt_func_score"]]
)
assert len(wt_scores) == len(df.groupby(["condition", "replicate"])), (
    f"Expected one WT per group, got {len(wt_scores)}"
)

df = df.merge(wt_scores, on=["condition", "replicate"])
df["func_score"] = df["func_score"] - df["wt_func_score"]
df = df.drop(columns=["wt_func_score"])
print("WT-subtracted func_score range: "
      f"[{df['func_score'].min():.3f}, {df['func_score'].max():.3f}]")
WT-subtracted func_score range: [-7.625, 2.805]
Clip functional scores
[16]:
clip_lo, clip_hi = func_score_clip
n_below = (df["func_score"] < clip_lo).sum()
n_above = (df["func_score"] > clip_hi).sum()
print(f"Clipping to [{clip_lo}, {clip_hi}]: {n_below:,} below, {n_above:,} above")
df["func_score"] = df["func_score"].clip(clip_lo, clip_hi)
Clipping to [-3.5, 2.5]: 16,400 below, 2 above
Subsample (test profile only)
[17]:
if subsample_frac is not None:
    n_before = len(df)
    wt_rows = df[df["aa_substitutions"] == ""]
    non_wt_rows = df[df["aa_substitutions"] != ""]
    subsampled = pd.concat([
        g.sample(frac=subsample_frac, random_state=seed)
        for _, g in non_wt_rows.groupby(["condition", "replicate"])
    ])
    df = pd.concat([wt_rows, subsampled]).reset_index(drop=True)
    print(f"Subsampled: {n_before:,} \u2192 {len(df):,} variants (frac={subsample_frac}, WT kept)")
else:
    print("No subsampling (production profile)")
No subsampling (production profile)
Save training data
[18]:
output_cols = ["aa_substitutions", "condition", "replicate", "func_score", "n_subs", "pre_count", "post_count"]
df_out = df[output_cols].copy()

output_path = os.path.join(output_dir, "training_functional_scores.csv")
df_out.to_csv(output_path, index=False)
print(f"Saved {output_path}")
print(f"  {len(df_out):,} variants")
print(f"  Conditions: {sorted(df_out['condition'].unique())}")
print(f"  Replicates: {sorted(df_out['replicate'].unique())}")
print(f"\nVariants per condition/replicate:")
print(df_out.groupby(["condition", "replicate"]).size().to_string())
Saved results/training_functional_scores.csv
  281,158 variants
  Conditions: ['Delta', 'Omicron_BA1', 'Omicron_BA2']
  Replicates: ['1', '2']

Variants per condition/replicate:
condition    replicate
Delta        1            27221
             2            26040
Omicron_BA1  1            62076
             2            55414
Omicron_BA2  1            56673
             2            53734
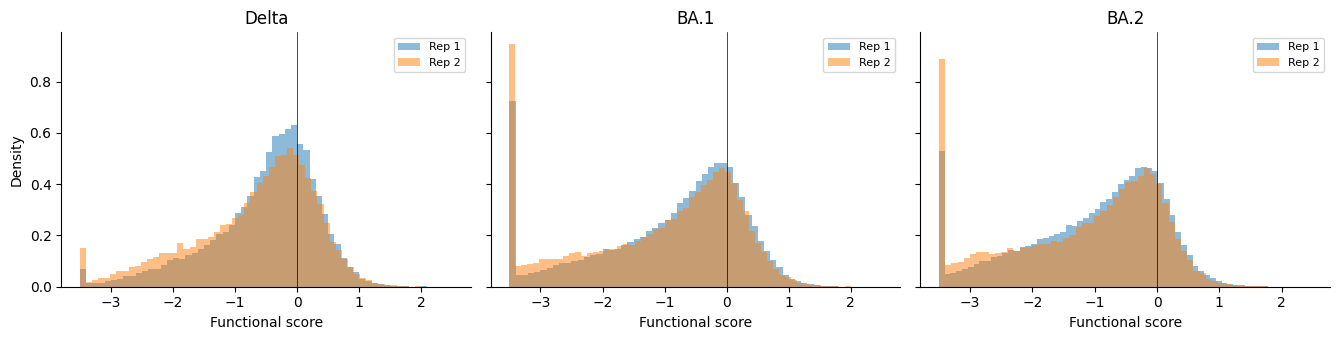
Functional score distributions
Histograms of functional scores per condition, overlaying both replicates.
[19]:
mutants = df.query("aa_substitutions != ''")

fig, axes = plt.subplots(
    1, len(experiment_conditions),
    figsize=(4.5 * len(experiment_conditions), 3.5),
    sharey=True,
)
for ax, cond in zip(axes, experiment_conditions):
    for rep in sorted(mutants["replicate"].unique()):
        subset = mutants.query("condition == @cond and replicate == @rep")
        ax.hist(
            subset["func_score"], bins=60, alpha=0.5,
            label=f"Rep {rep}", density=True,
        )
    ax.axvline(0, color="black", linestyle="-", linewidth=0.5)
    ax.set_xlabel("Functional score")
    if ax == axes[0]:
        ax.set_ylabel("Density")
    ax.set_title(condition_titles.get(cond, cond))
    ax.legend(fontsize=8)
    ax.spines[["top", "right"]].set_visible(False)
plt.tight_layout()
plt.show()
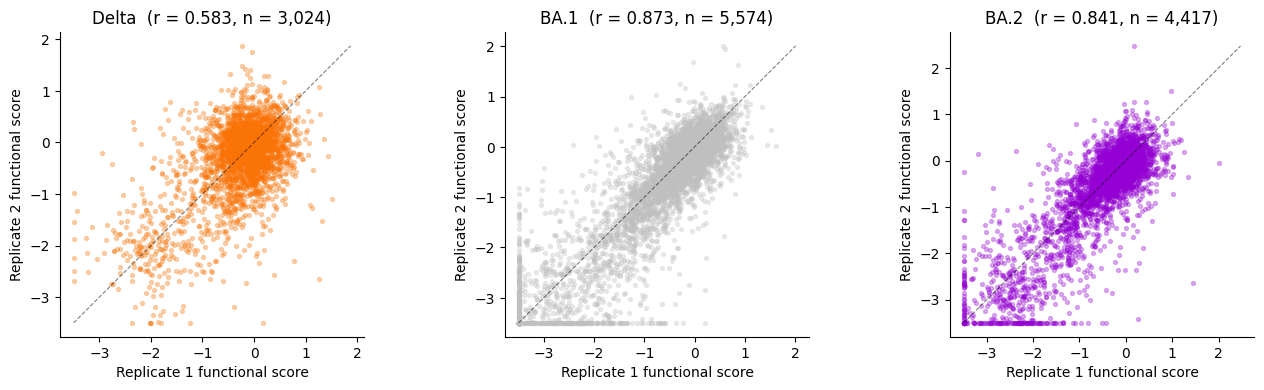
Replicate correlation analysis
For each condition, merge replicate 1 and replicate 2 functional scores on aa_substitutions, then compute the Pearson correlation. High replicate correlations (r > 0.8) validate the data preparation.
[20]:
replicates = sorted(df["replicate"].unique())
corr_data = {}
for cond in experiment_conditions:
    rep1 = (
        df.query("condition == @cond and replicate == @replicates[0] and aa_substitutions != ''")
        [["aa_substitutions", "func_score"]]
        .rename(columns={"func_score": "rep1"})
    )
    rep2 = (
        df.query("condition == @cond and replicate == @replicates[1] and aa_substitutions != ''")
        [["aa_substitutions", "func_score"]]
        .rename(columns={"func_score": "rep2"})
    )
    merged = rep1.merge(rep2, on="aa_substitutions", how="inner")
    if len(merged) >= 2:
        r, p = stats.pearsonr(merged["rep1"], merged["rep2"])
    else:
        r, p = float("nan"), float("nan")
    corr_data[cond] = {"merged": merged, "r": r, "p": p, "n": len(merged)}
    print(f"{condition_titles.get(cond, cond):>6s}: r = {r:.4f}  (n = {len(merged):,} shared variants)")
 Delta: r = 0.5831  (n = 3,024 shared variants)
  BA.1: r = 0.8733  (n = 5,574 shared variants)
  BA.2: r = 0.8408  (n = 4,417 shared variants)
[21]:
fig, axes = plt.subplots(
    1, len(experiment_conditions),
    figsize=(4.5 * len(experiment_conditions), 4),
)
for ax, cond in zip(axes, experiment_conditions):
    merged = corr_data[cond]["merged"]
    r = corr_data[cond]["r"]
    color = condition_colors[cond]

    ax.scatter(
        merged["rep1"], merged["rep2"],
        s=8, alpha=0.3, color=color, rasterized=True,
    )
    # Identity line
    if len(merged) > 0:
        lims = [
            min(merged["rep1"].min(), merged["rep2"].min()),
            max(merged["rep1"].max(), merged["rep2"].max()),
        ]
        ax.plot(lims, lims, "k--", linewidth=0.8, alpha=0.5)
    ax.set_xlabel("Replicate 1 functional score")
    ax.set_ylabel("Replicate 2 functional score")
    title = condition_titles.get(cond, cond)
    ax.set_title(f"{title}  (r = {r:.3f}, n = {len(merged):,})")
    ax.set_aspect("equal", adjustable="box")
    ax.spines[["top", "right"]].set_visible(False)

plt.tight_layout()
plt.show()